Bitcoin’s relationship with the Federal Reserve has gone through a real transformation over the past several years, and the shift now looks clear enough to treat as a market structure development rather than a passing observation.


A familiar version of the idea shows up as a quick market stat. Bitcoin often falls after Fed meetings.
The longer historical record adds far more value. Extending the review back to the Federal Reserve’s 2020 FOMC schedule, and carrying it forward through the current 2026 meeting calendar, shows a market that moved from uneven post-FOMC reactions into a far more recognizable downside bias during 2024, 2025, and the opening stretch of 2026.
That evolution says a great deal about where Bitcoin now sits in the global asset mix. Bitcoin trades inside the same calendar gravity that shapes equities, rates, foreign exchange, and broader risk sentiment. The Fed meeting itself has become part of the pricing rhythm.

The history of Bitcoin performance after Fed meetings
Starting in 2020, the picture looks loose, uneven, and highly dependent on the surrounding macro regime. Scheduled FOMC meetings did not produce a clean, repeatable downside response in Bitcoin.
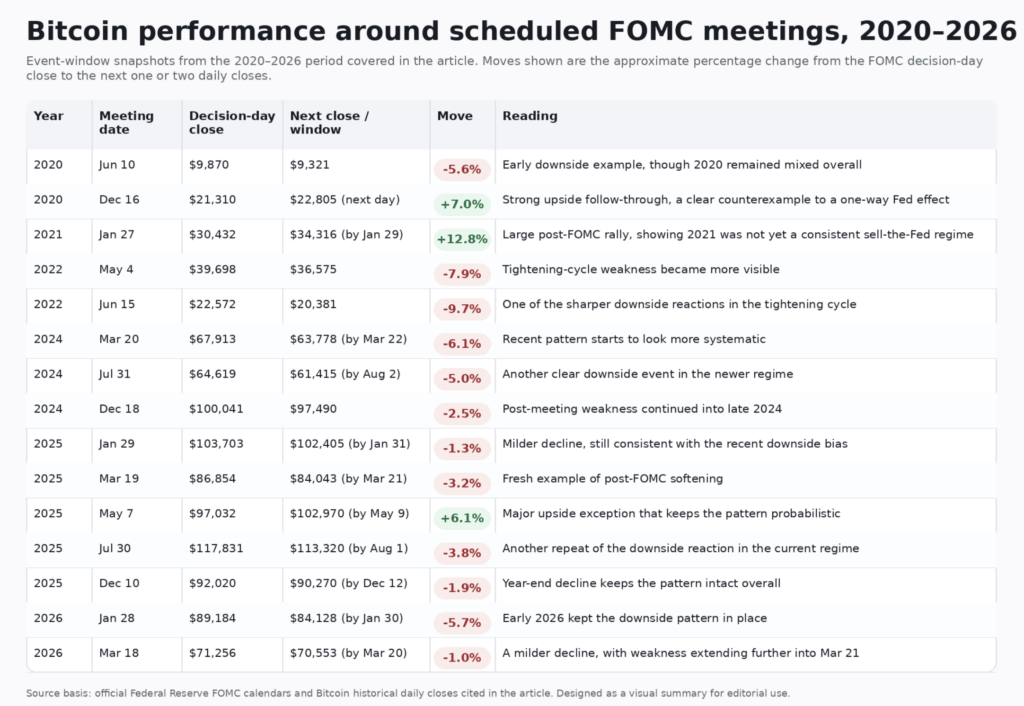
June 10, 2020 saw a sharp drop into the following session, with BTC sliding from $9,870. to $9,321.
A trader looking at that move could easily build a bearish Fed thesis. The rest of the year complicates that view. July 29 finished roughly flat to up. November 5 held near highs. December 16 opened the door to a strong continuation higher, with Bitcoin climbing from $21,310 to $22,805 the next day and then to $23,137 a day later.
That is an early clue about what the long sample says. In Bitcoin’s earlier macro era, Fed meetings functioned as one catalyst among many.
Liquidity conditions, pandemic-era policy response, narrative momentum, and broad speculative appetite all competed for control of price action. The FOMC calendar exerted influence, though it had not yet set the rhythm of post-event positioning.
Moving into 2021, the same inconsistency remains. January 27 was followed by a sharp rally, with BTC jumping from $30,432 to $34,316 by January 29. July 28 also pushed higher into month-end.
Other meetings leaned in the opposite direction. March 17, April 28, June 16, November 3, and December 15 all softened over the next one or two sessions.
The result is a mixed year where Bitcoin clearly recognized the Fed as a macro event, while the reaction still lacked the kind of persistent directional bias traders look for when they want a calendar-based edge.
That distinction keeps the historical framing honest. Bitcoin has been macro-sensitive for years.

A systematic sell-the-Fed tendency emerged later
By 2022, the environment had changed. The Fed entered its aggressive tightening cycle, inflation dominated the macro conversation, and risk assets across the board grew more vulnerable to policy shocks.
Bitcoin reflected that shift. May 4 and June 15 produced notable downside. BTC fell from $39,698 to $36,575 after the May meeting. It dropped from $22,572 to $20,381 after June. Those were meaningful reactions, especially in the context of a market already under pressure from tighter liquidity and weaker risk appetite.
Even then, the pattern resisted any claim of total consistency. January 26 and July 27 both delivered upside follow-through.
Bitcoin in 2022 behaved like an asset deeply exposed to tightening conditions, while still capable of rallying around Fed events when positioning, expectations, and sentiment aligned the right way.
The broader takeaway from 2022 sits in the direction of travel. FOMC days were becoming more sensitive and more central to short-term risk management.
Then came 2023, another year that kept the transition visible without fully locking it in place.
February 1 faded. March 22 and June 14 pushed higher. July 26 stayed close to flat. November 1 faded. December 13 slipped into December 15. Again, mixed. Again, macro sensitivity without a fully reliable one-way reaction.
Bitcoin still had room to surprise in either direction after a Fed decision. The event was important. The directional pattern remained open.

The real shift appears in 2024 and extends through 2025 and into 2026
That is where ‘sell the Fed’ starts looking more like an emerging behavior.
March 20, 2024 was followed by one of the clearest examples. Bitcoin fell from $67,913 to $63,778 by March 22, a drop of roughly 6.1%. J
uly 31 delivered another clean post-event decline, with BTC sliding from $64,619 to $61,415 by August 2, around 5.0%. June 12 also softened. December 18 moved lower from $100,041 to $97,490 the next day.
Those reactions attract attention because they cluster. Once a market sees repeated downside windows after a recurring calendar event, participants begin to anticipate the pattern.
Anticipation then changes positioning. Positioning then changes the event itself. That is how a loose tendency turns into a stronger regime feature.
Then, in 2025, the pattern pushed further.
January 29 to January 31 drifted lower from $103,703 to $102,405. March 19 to March 21 fell from $86,854 to $84,043, a roughly 3.2% decrease.
June 18 to June 20 edged lower. July 30 to August 1 dropped from $117,831 to $113,320, around 3.8%. September 17 to September 19 softened. October 29 to October 31 slipped. December 10 to December 12 moved down from $92,020 to $90,270.
However, there was a major upside exception in May 2025.
Bitcoin rose from $97,032 on May 7 to $102,970 by May 9, a gain of about 6.1%. That move deserves full inclusion because a pattern can become systematic without becoming universal. In markets, those are very different things.
In the present year, two scheduled meetings have already taken place, on January 27 to 28 and March 17 to 18, with the next meeting set for April 28 to 29.
The January 2026 Bitcoin daily close data shows BTC at $89,184 on January 28 and $84,128 on January 30, a decline of about 5.7% across the next two daily closes.
March saw BTC at $71,256 on March 18 and $70,553 on March 20, a decline of about 1%, with the drawdown extending to $68,734 by March 21.
Thus, the downside bias that became much clearer in 2024 and 2025 has therefore carried into 2026 as well.
The current-year follow-through suggests the market is still treating Fed dates as moments to reduce exposure and de-risk post-event.
Bitcoin did not spend the entire 2020 to 2026 period selling off after Fed meetings. Across that stretch, Bitcoin became increasingly likely to treat Fed meetings as de-risking events, with that behavior becoming much clearer during 2024, 2025, and early 2026.
That shift opens up a more interesting macro conversation
Bitcoin’s post-FOMC behavior now looks more like the behavior of an asset that has matured into the core risk complex.
As institutional participation deepened and macro desks paid closer attention, Bitcoin moved closer to the same event framework that governs other highly liquid assets. FOMC days became known quantities on the calendar. Known quantities invite pre-positioning.
Pre-positioning invites profit-taking, volatility compression ahead of the event, and quick reductions in exposure once the news passes.
In that sense, the direction of the Fed decision becomes only one part of the equation.
The date itself starts carrying weight. A heavily anticipated event can create downside pressure even when the policy outcome lands close to consensus.
Once a decision is priced, the market shifts attention toward communication, tone, risk appetite, and whether investors want to carry exposure through the next 24 to 48 hours.
Bitcoin’s recent behavior around Fed meetings suggests that calendar risk now plays a larger role in that calculus.
There is also a structural reason this dynamic has staying power. The Federal Open Market Committee holds eight regularly scheduled meetings each year. That creates one of the cleanest recurring catalysts in global markets, with extensive pre-positioning, intense cross-asset attention, and a large information burst compressed into a narrow time window.
Bitcoin’s growing correlation to broader risk sentiment and its integration into institutional portfolios make that event window much more consequential than it was in earlier cycles.
The broader conclusion becomes clearer here. Bitcoin’s growing sensitivity to FOMC dates points to its continued evolution into an asset class that lives inside macro time.
Earlier in its life, Bitcoin often moved to its own rhythm, driven by internal cycles, crypto-native catalysts, and bursts of narrative momentum that seemed disconnected from the economic calendar.
Today, the calendar itself has become part of Bitcoin’s pricing architecture.
Bitcoin’s development comes with trade-offs
Greater institutional relevance brings greater exposure to the same policy expectations that shape every major risk asset.
Deeper macro integration creates more legitimacy, more capital access, and more cross-market participation. It also creates recurring pressure points. Fed meetings now appear to be one of them.
For traders, that means post-FOMC weakness deserves a place on the playbook, especially in a regime where recent history has shown repeated downside follow-through.
For investors and analysts, the bigger takeaway sits one level higher. Bitcoin’s reaction function increasingly resembles the reaction function of a mature global asset, one that responds to policy cadence, liquidity expectations, and the mechanics of event-driven positioning with growing consistency.
The market has moved beyond a world where Bitcoin simply reacts to good or bad Fed news in a straightforward way. It now trades through a more complex macro lens, where the event window itself can shape behavior before the market fully processes the decision.
That is a sign of development, integration, and that Bitcoin’s role in the financial system continues to evolve.
The long record strips out the temptation to overstate the pattern as a permanent historical rule. The recent record shows why traders increasingly respect it anyway.
Put those together, and the conclusion is strong: the sell-the-Fed dynamic has emerged as a meaningful feature of Bitcoin’s current market structure, and its rise says as much about Bitcoin’s maturation as it does about any individual Fed meeting.